IoT MQTT Panel for Android
This article describes configuring Sowilo Box to be used with the IoT MQTT Panel application with pre-built firmware over a public MQTT server test.mosquitto.org.
To Buy IoT SOWILLO boards:
-
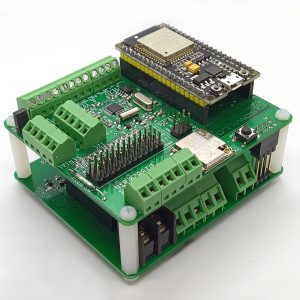 Sowillo IoT board$30,00 – $96,95
 -
 SCT-013-15A non-invasive AC current sensor$9,23
 -
 D18B20 temperature IoT sensorProduct on sale$3,46
MQTT is a standard IoT protocol for data exchange between devices. It is very popular, lightweight, and supports the publish/subscribe messaging model. It is supported in almost every modern IoT product. You can find more information on mosquitto.org, hivemq.com.
Sowillo IoT board comes with a pre-flashed firmware that will connect to a public MQTT server (default: test.mosquitto.org). If you have different firmware, please download and flash the binary from <link> and flash as described in <link>. We provide several variants of pre-build firmware for common public MQTT servers. After getting some experience, you areit is advised to build your custom firmware for usage with your custom server. Please see <…> when you’re ready to dive in.
First, you need to connect your Sowillo IoT board to WiFi. This can be done via the captive portal as described <here>.
Pro hint: You may want to connect to the MQTT server test.mosquitto.org and verify that the board sends data by monitoring the topic:
energymeter_hw_300-aabbcc/sensor/energymeter_hw_300_uptime_human_readable/state or others described in the following section. Please, replace ‘aabbcc’ with your board address which you can find on the captive portal page.
Begin by installing the IoT MQTT Panel application to your Android phone. <QR code?>
We used this app as an example, you can use any MQTT tool you want, just search MQTT in Play Market/App Store.
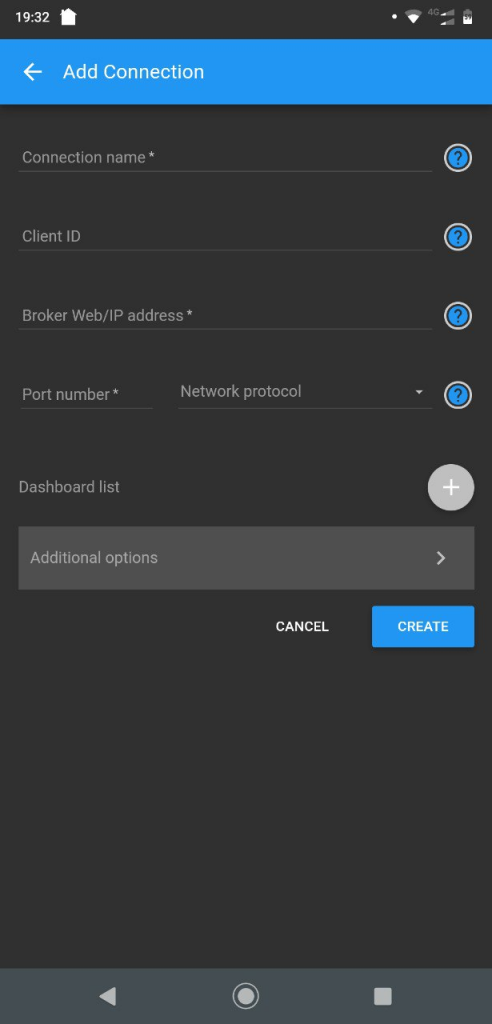
Create a connection to public broker test.mosquitto.org and fill in the following data:
- Connection name: MyTestConnection
- Client ID: MyTestClient
- Broker Web/IP address: test.mosquitto.org
- Port number: 1883
- Network protocol: TCP
Add a new dashboard to the Dashboard list and name it TestBoard.
Then press the Create button.
Each example FW uses its own unique six char prefix for state and command topics based on the last 3 bytes of the individual MAC address ESP32 board.
For example, a unique MAC address 00:11:22:AA:BB:CC generates MQTT topics that look like:
energymeter_hw_300-aabbcc/switch/energymeter_hw_300_reboot/state
energymeter_hw_300-aabbcc/switch/energymeter_hw_300_reboot/command
energymeter_hw_300-aabbcc/switch/energymeter_hw_300_relay1/state
energymeter_hw_300-aabbcc/switch/energymeter_hw_300_relay1/command
energymeter_hw_300-aabbcc/switch/energymeter_hw_300_relay2/state
energymeter_hw_300-aabbcc/switch/energymeter_hw_300_relay2/command
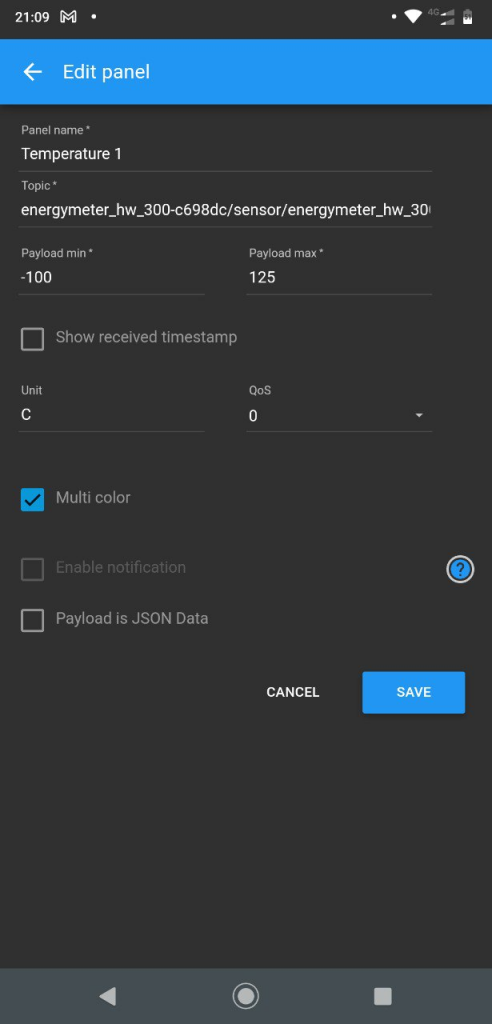
energymeter_hw_300-aabbcc/sensor/energymeter_hw_300_temperature_1/state
energymeter_hw_300-aabbcc/sensor/energymeter_hw_300_temperature_2/state
energymeter_hw_300-aabbcc/sensor/energymeter_hw_300_uptime_human_readable/state
energymeter_hw_300-aabbcc/sensor/energymeter_hw_300_current/state
Note: You can find this information in the Captive Portal.
You may want to add panels with sensor metrics, and relay controls to the dashboard just created. You can do it as follows:
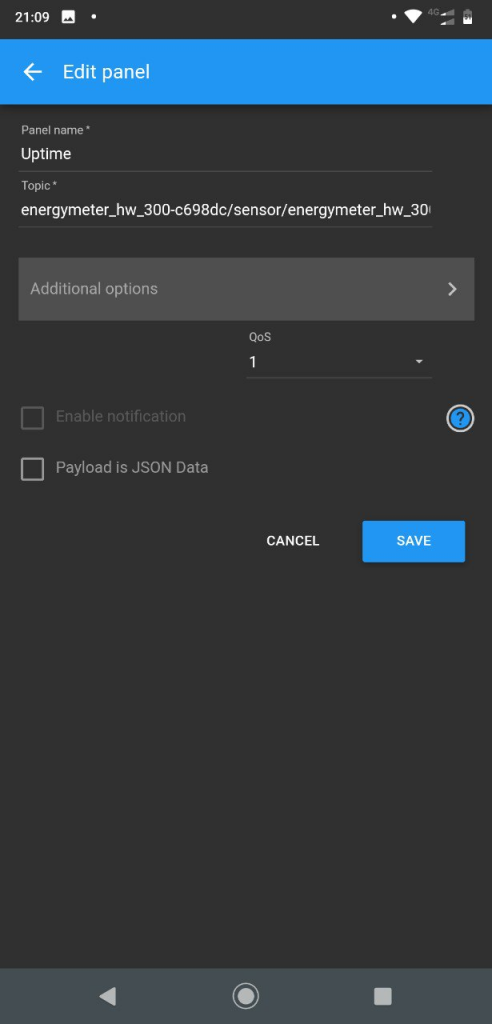
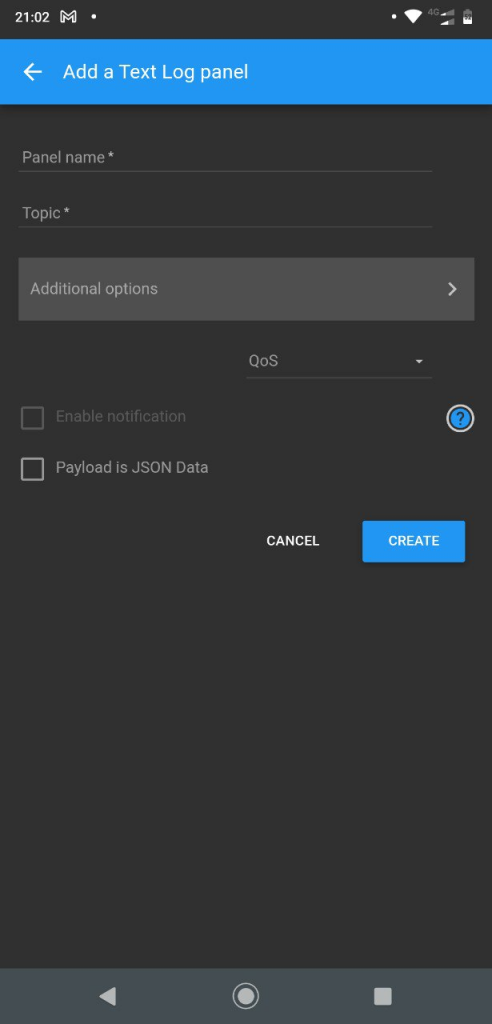
Open TestBoard and press the AddPanel button. Select Text Log and fill the following fields:
- Panel Name: Uptime
- Topic: energymeter_hw_300-aabbcc/sensor/energymeter_hw_300_uptime_human_readable/state

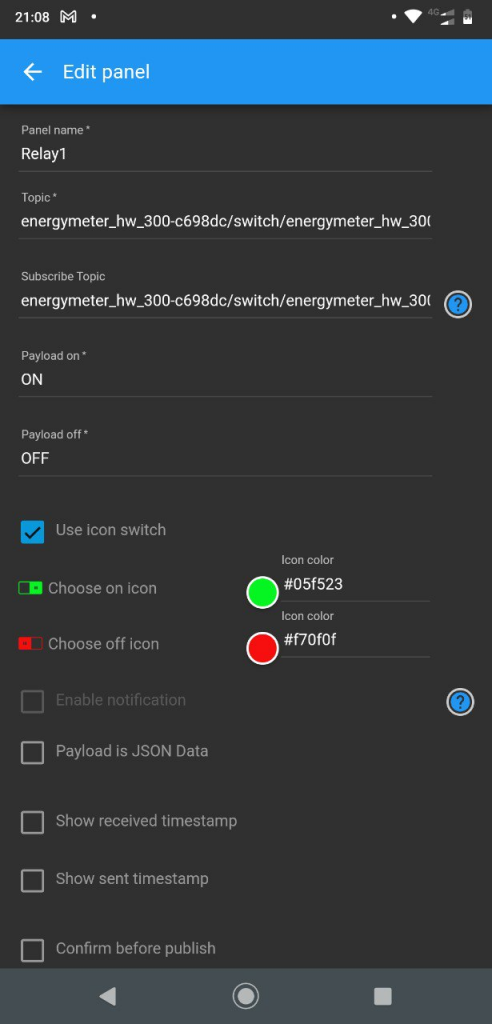
In addition to the TextLog, there are Switch, Vertical Meter, Gauge, and many other panes for commonly used sensor and switch types.
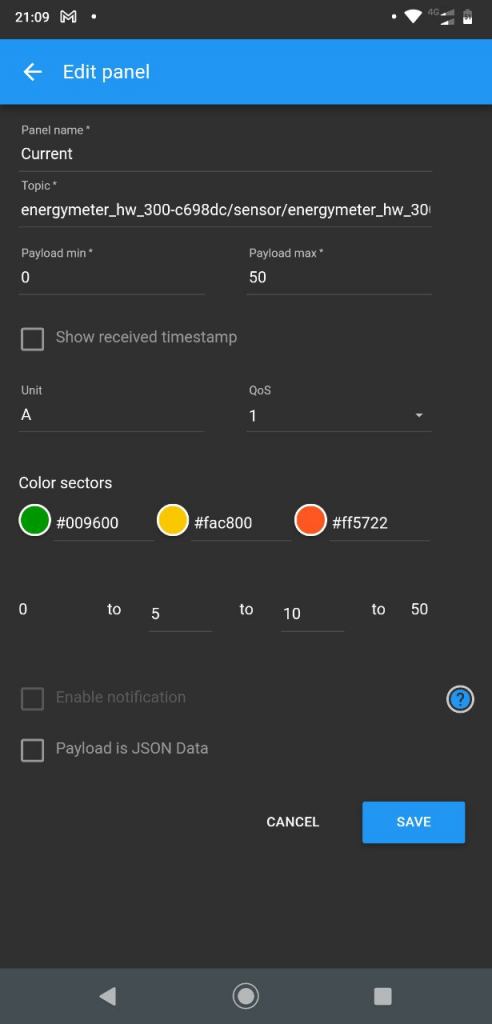
Other panels could be added in a similar way:
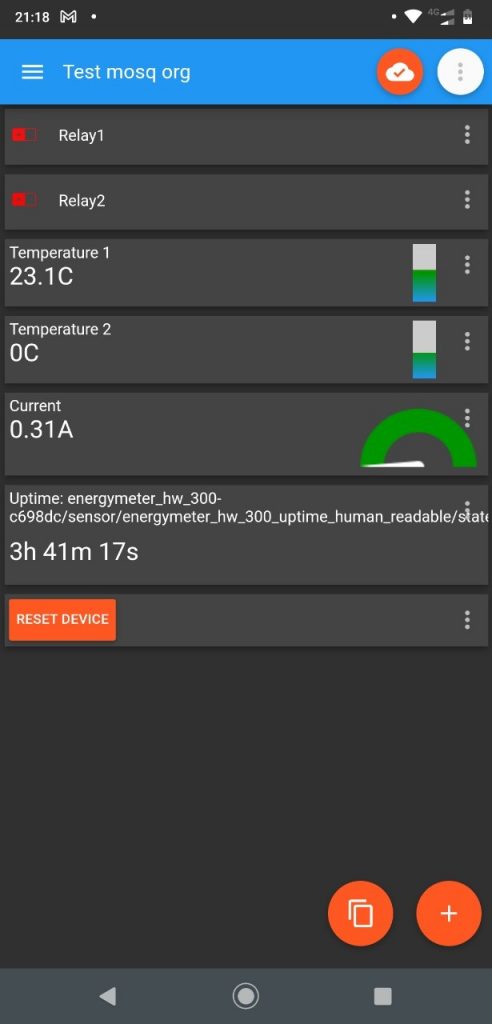
The final dashboard has the following look:
